• Product
  • Pricing
  • Docs
  • Using PostHog
  • Community
  • Company
  • Login
  • Docs

  • Overview
    • Quickstart with PostHog Cloud
    • Overview
    • Open-Source
      • Disclaimer
      • Deployment
      • Support
    • Enterprise
      • Overview
      • Support
      • Hosting Costs
        • AWS
        • Azure
        • DigitalOcean
        • Google Cloud Platform
        • EU Hosting Companies
        • Other platforms
      • Instance settings
      • Environment variables
      • Securing PostHog
      • Monitoring with Grafana
      • Running behind a proxy
      • Configuring email
      • Helm chart configuration
      • Deploying ClickHouse using Altinity.Cloud
      • Configuring Slack
      • Overview
        • Overview
        • Upgrade notes
        • Overview
        • 0001-events-sample-by
        • 0002_events_sample_by
        • 0003_fill_person_distinct_id2
        • ClickHouse
          • Backup
          • Debug hanging / freezing process
          • Horizontal scaling (Sharding & replication)
          • Kafka Engine
          • Resize disk
          • Restore
          • Vertical scaling
        • Kafka
          • Resize disk
          • Log retention
        • PostgreSQL
          • Resize disk
          • Troubleshooting long-running migrations
        • Plugin server
          • Overview
          • Ingestion lag
          • Jobs not executing
          • Scheduled tasks not executing
        • MinIO
        • Redis
        • Zookeeper
      • Disaster recovery
    • Troubleshooting and FAQs
    • Overview
    • Ingest live data
    • Ingest historical data
    • Identify users
    • User properties
    • Using a CDP
    • Deploying a reverse proxy
    • Library comparison
    • Badge
    • Browser extensions
      • Snippet installation
      • Android
      • iOS
      • JavaScript
      • Flutter
      • React Native
      • Node.js
      • Go
      • Python
      • Rust
      • Java
      • PHP
      • Ruby
      • Elixir
      • Docusaurus v2
      • Gatsby
      • Google Tag Manager
      • Next.js
      • Nuxt.js
      • Retool
      • RudderStack
      • Segment
      • Sentry
      • Slack
      • Shopify
      • WordPress
      • Message formatting
      • Microsoft Teams
      • Slack
      • Discord
    • Migrate between PostHog instances
    • Migrate from Amplitude
    • Migrate to PostHog Cloud EU
    • To another self-hosted instance
    • Export your events
    • Overview
    • Tutorial
    • Troubleshooting
    • Developer reference
    • Using the PostHog API
    • Jobs
    • Testing
    • TypeScript types
    • Overview
    • POST-only public endpoints
    • Actions
    • Annotations
    • Cohorts
    • Dashboards
    • Event definitions
    • Events
    • Experiments
    • Feature flags
    • Funnels
    • Groups
    • Groups types
    • Insights
    • Invites
    • Members
    • Persons
    • Plugin configs
    • Plugins
    • Projects
    • Property definitions
    • Session recordings
    • Trends
    • Users
    • Data model
    • Overview
    • Data model
    • Ingestion pipeline
    • ClickHouse
    • Querying data
    • Overview
    • GDPR guidance
    • HIPAA guidance
    • CCPA guidance
    • SOC 2
    • Data egress & compliance
    • Data deletion
    • Overview
    • Code of conduct
    • Recognizing contributions
  • Using PostHog

  • Table of contents
      • Dashboards
      • Funnels
      • Group Analytics
      • Insights
      • Lifecycle
      • Path analysis
      • Retention
      • Stickiness
      • Trends
      • Heatmaps
      • Session Recording
      • Correlation Analysis
      • Experimentation
      • Feature Flags
      • Actions
      • Annotations
      • Cohorts
      • Data Management
      • Events
      • Persons
      • Sessions
      • UTM segmentation
      • Team collaboration
      • Organizations & projects
      • Settings
      • SSO & SAML
      • Toolbar
      • Notifications & alerts
    • Overview
      • Amazon Kinesis Import
      • BitBucket Release Tracker
      • Event Replicator
      • GitHub Release Tracker
      • GitHub Star Sync
      • GitLab Release Tracker
      • Heartbeat
      • Ingestion Alert
      • Email Scoring
      • n8n Connector
      • Orbit Connector
      • Redshift Import
      • Rudderstack Import
      • Segment Connector
      • Shopify Connector
      • Stripe Connector
      • Twitter Followers Tracker
      • Zendesk Connector
      • Airbyte Exporter
      • Amazon S3 Export
      • Avo Inspector
      • BigQuery Export
      • Customer.io Connector
      • Databricks Export
      • Engage Connector
      • GCP Pub/Sub Connector
      • Google Cloud Storage Export
      • Hubspot Connector
      • Intercom Connector
      • PagerDuty Connector
      • PostgreSQL Export
      • Redshift Export
      • RudderStack Export
      • Salesforce Connector
      • Sendgrid Connector
      • Sentry Connector
      • Snowflake Export
      • Twilio Connector
      • Variance Connector
      • Pace Integration
      • Zapier Connector
      • Downsampler
      • Event Sequence Timer
      • First Time Event Tracker
      • Property Filter
      • Property Flattener
      • Schema Enforcer
      • Taxonomy Standardizer
      • Unduplicator
      • Advanced GeoIP Enricher
      • Automatic Cohort Creator
      • Currency Normalizer
      • GeoIP Enricher
      • Timestamp Parser
      • URL Normalizer
      • User Agent Populator
      • Pineapple Mode
  • Tutorials
    • Actions
    • Apps
    • Cohorts
    • Configuration
    • Data management
    • Dashboards
    • Experimentation
    • Feature flags
    • Funnels
    • Group analytics
    • Heatmaps
    • Insights
    • Path analysis
    • Retention
    • Session recording
    • Toolbar
    • Trends
  • Support
  • Glossary

What to do after installing PostHog in 5 steps

You created a PostHog account and installed it on your site, but what’s next? This tutorial goes over what to do after signing up and installing PostHog (we are assuming you’ve done both).

1. Configure event capture

To get the best possible understanding of your product, you need as much data as possible. Capturing the most possible events helps you do this. PostHog makes it easy.

Autocapture is enabled by default if you've installed either the PostHog snippet or posthog-js. That means your product will send pageviews, button clicks, inputs, and more to PostHog automatically.

With either of these installed, you can also enable session recordings in “Project Settings”, under "Recordings.”

If you are using a different library or the API, you’ll need to implement event capture yourself. Luckily, our libraries make this easy, just a single call. Event capture calls look like this:

posthog.capture(
'movie played',
{
movieId: 'Return of the Hedgehogs',
category: 'thriller'
}
);

To figure out which events you should capture, think about which areas have the biggest impact on your product or north star metrics. As a minimum, we recommend capturing events such as:

  • signups
  • logins
  • purchases and subscriptions
  • feature usage
  • page and component views

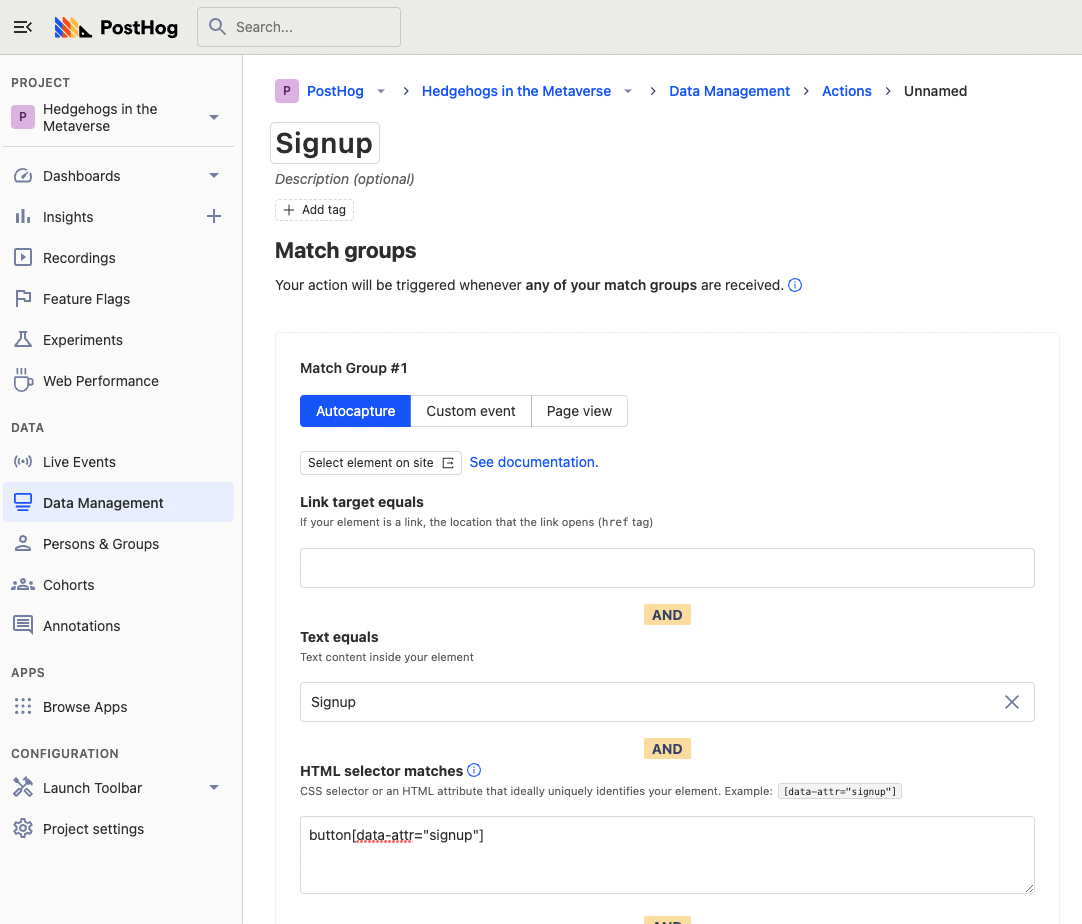
Once you've started capturing events, you can create actions (a combination of one or more events) to better represent user behavior. Actions are created in the “Data Management” section of the sidebar or interactively using the toolbar (click “Launch Toolbar” on the sidebar).

Action

Be sure to add properties to your events to better capture variables such as the value, type, or version. For example, you might want to know which version of the product someone is using or if they are a customer or not. Properties can help you here, and you can set them for users as well.

Finally, you may also want to connect to external services like Stripe or HubSpot to get data. You can do that using apps. To install an app, search for it in “browse apps,” then configure and activate it.

2. Build a dashboard

Once you’ve got events flowing in, you’ll want to use that data to better understand your product. Our insight tools like trends, retention, and funnels help you do this.

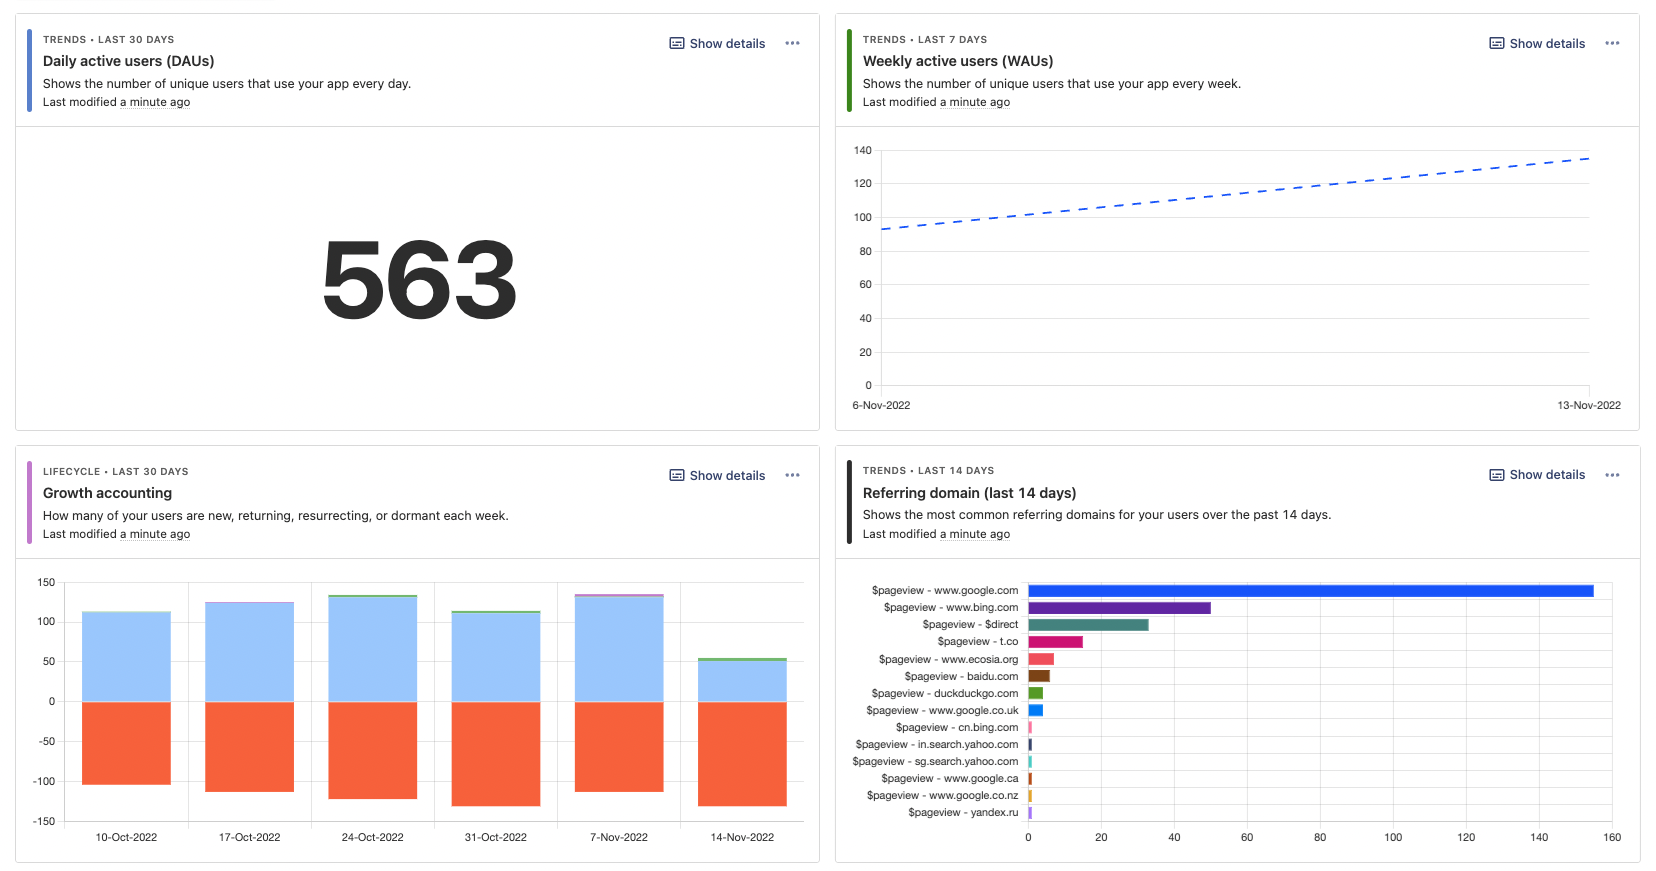
We recommend creating a dashboard of insights, instead of creating them one at a time. This allows you to get a better overall understanding of your product.

As you create your dashboard, keep in mind what data you are capturing. If you are missing something, you can go to your product and add it.

Some recommendations include:

  • Key product analytics: usage trends, feature conversion, daily/weekly active users, retention
  • Website traffic: overall traffic, top-performing pages, traffic breakdowns, sources
  • AARRR: signup trends, usage trends, customer retention, revenue growth trends, attribution table
  • Company scorecard: key metric trends, signups, success rate trends, conversion funnels, revenue

Want to create dashboards quickly? PostHog offers several templates to cover common areas of interest, such as website traffic. To use a template, select an option from the "Template" dropdown when creating a new dashboard.

Dashboard

Creating a dashboard will give you an understanding of the different types of insights you can create, from trends to retention. It will also help you refine the events you capture to better match what you want in your dashboard.

3. Invite your team

Now that you’ve set up PostHog with data and dashboards, your teammates can benefit from all your hard work. Inviting your teammates to PostHog allows you to share data, insights, and dashboards. Engineers, product managers, data analysts, markets, and executives can all benefit from this. It also helps in collaboration using our tools to improve your product.

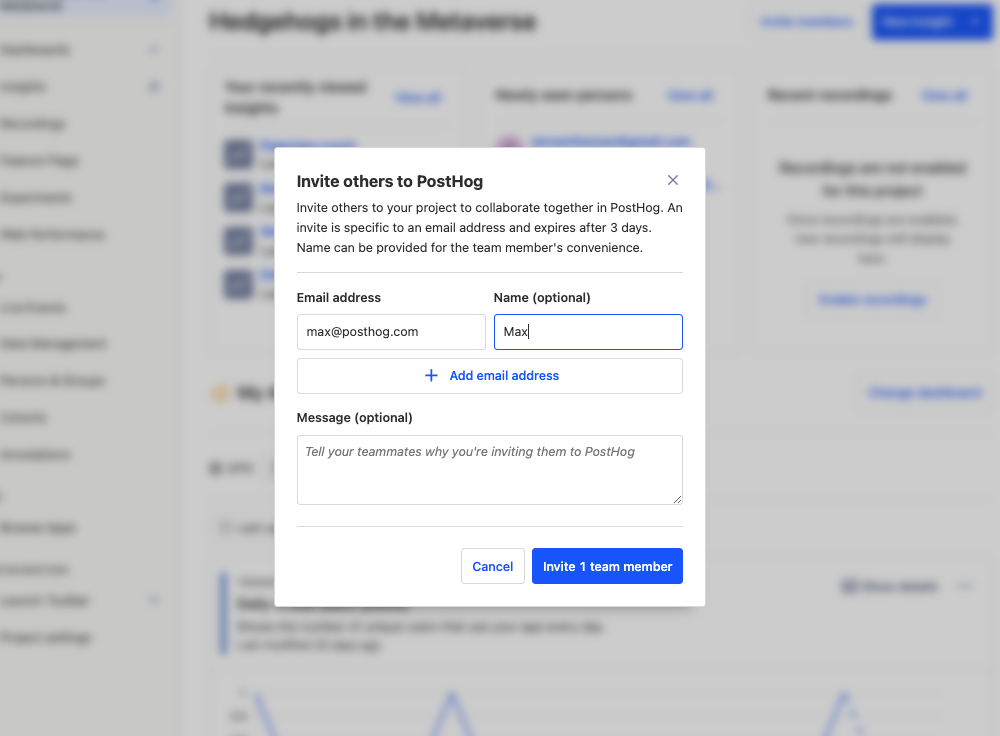
To invite your teammates, go to your instance homepage, click the "Invite" button, and add their email. This will add them to your organization with access to all your projects.

Invite

To make sure they don’t mess up all your hard work, you can change their access levels in your organization settings. Setting them to “Member” will prevent them from deleting or changing the settings in your project or instances. You can also set up projects you don’t want others to access as private in the project settings.

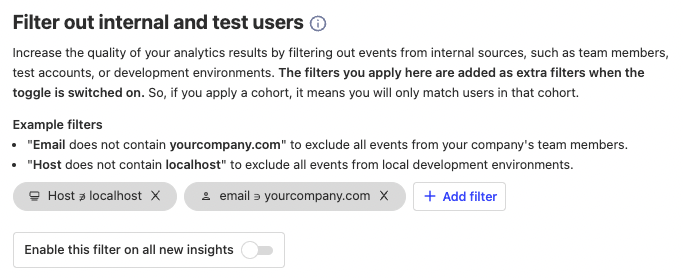
When working with others, you likely will want to filter out events they trigger when doing analysis. To set this up, go to ”Project Settings”, scroll down to “filter out internal and test users” and add filters such as host does not include local development addresses and email does not include your company’s domain.

Filter

4. Create subscriptions to important events, actions, and dashboards

Once everyone’s onboard with PostHog, you'll want to keep data and insights top of mind to help you improve your product. To do this, you can send data and dashboards to your email, Slack, and other apps using webhooks and subscriptions.

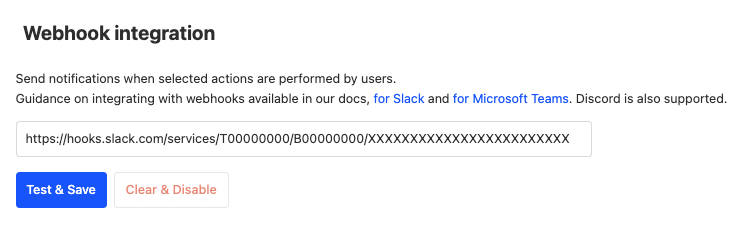
If there are key events or actions you want to track, such as a potential customer visiting your pricing page, you can have it trigger a webhook. This requires setting up the webhook in the service of your choice (like Slack, Teams, Zapier, or Discord). You can then add the webhook to your PostHog instance in “Project Settings” under “webhook integration.” Finally, go to data management, create or select an action, then enable “post to webhook when this action is triggered.”

Webhook

You can also subscribe to dashboards in Slack or via email. Just go to your dashboard, click the three dots to the left of share, click “subscribe,” and “new subscription.” If you want to send dashboards to Slack, you’ll need to configure our Slack integration. If you want dashboards by email, just fill in the details like the name, email, and recurrence, then click “create subscription.”

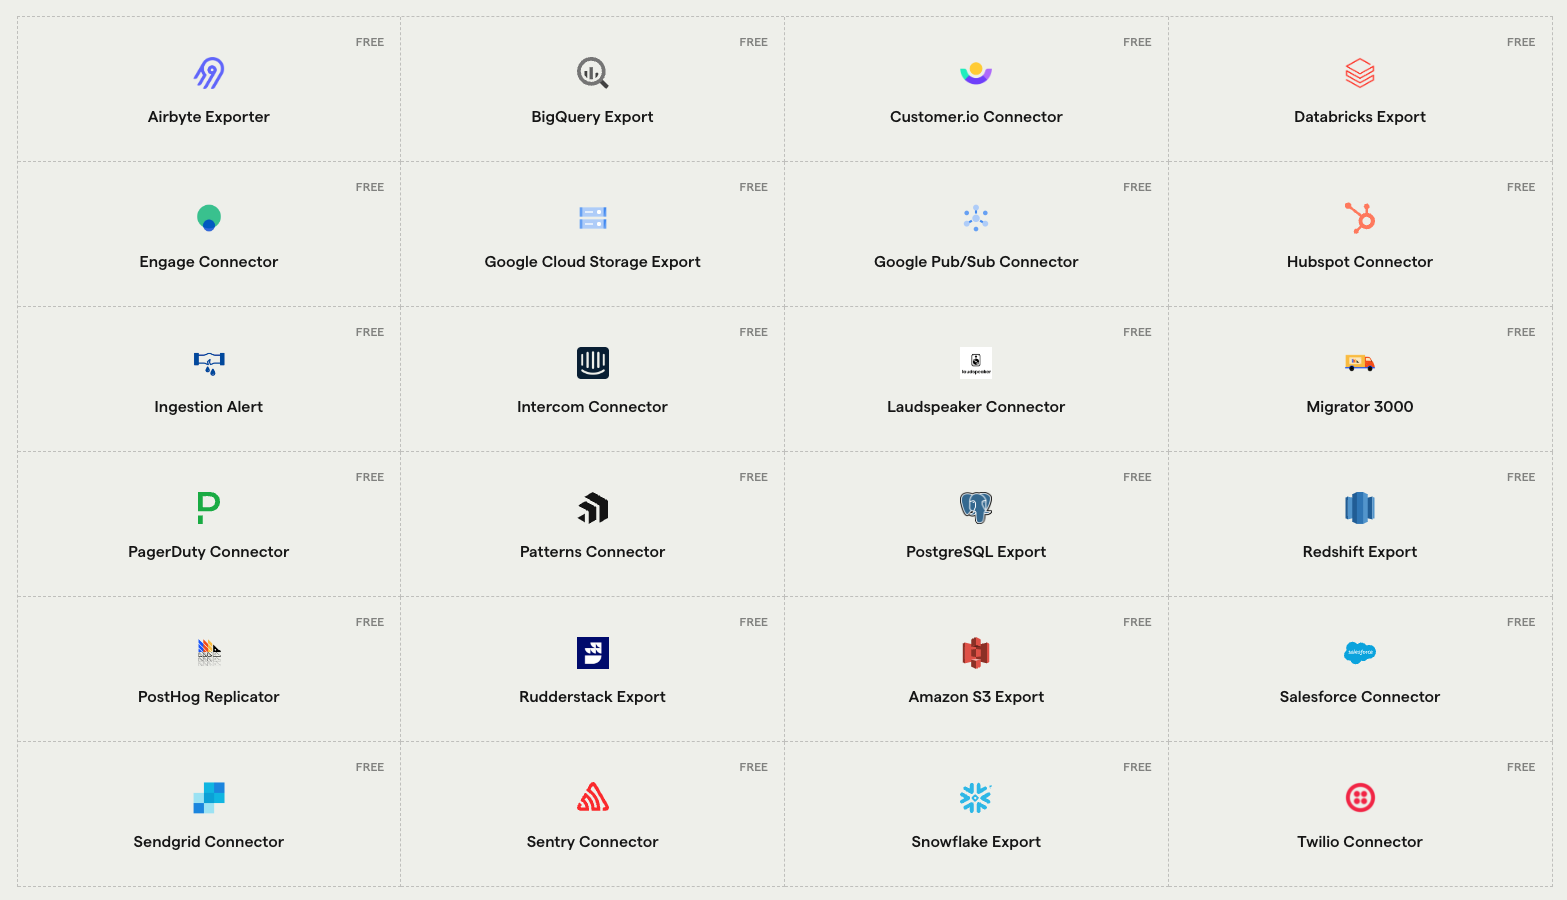
Finally, if you want your data backed up or sent to an external service such as BigQuery, S3, or Snowflake, you can use one of our many “data-out” apps. Just go to “browse apps,” search for the one you want, configure it, and start sending the data to the other places you want it.

Data-out apps

5. Experiment to improve your product

Once you have some data, and you’ve had a chance to gain some insights from it, it’s time to start using those insights to improve your product. A great way to do this is with Experiments.

Experiments in PostHog help you test if changes improve your product in the ways you care about. They provide structure for your tests by requiring variants, participants (like new users), and goals.

Experiments

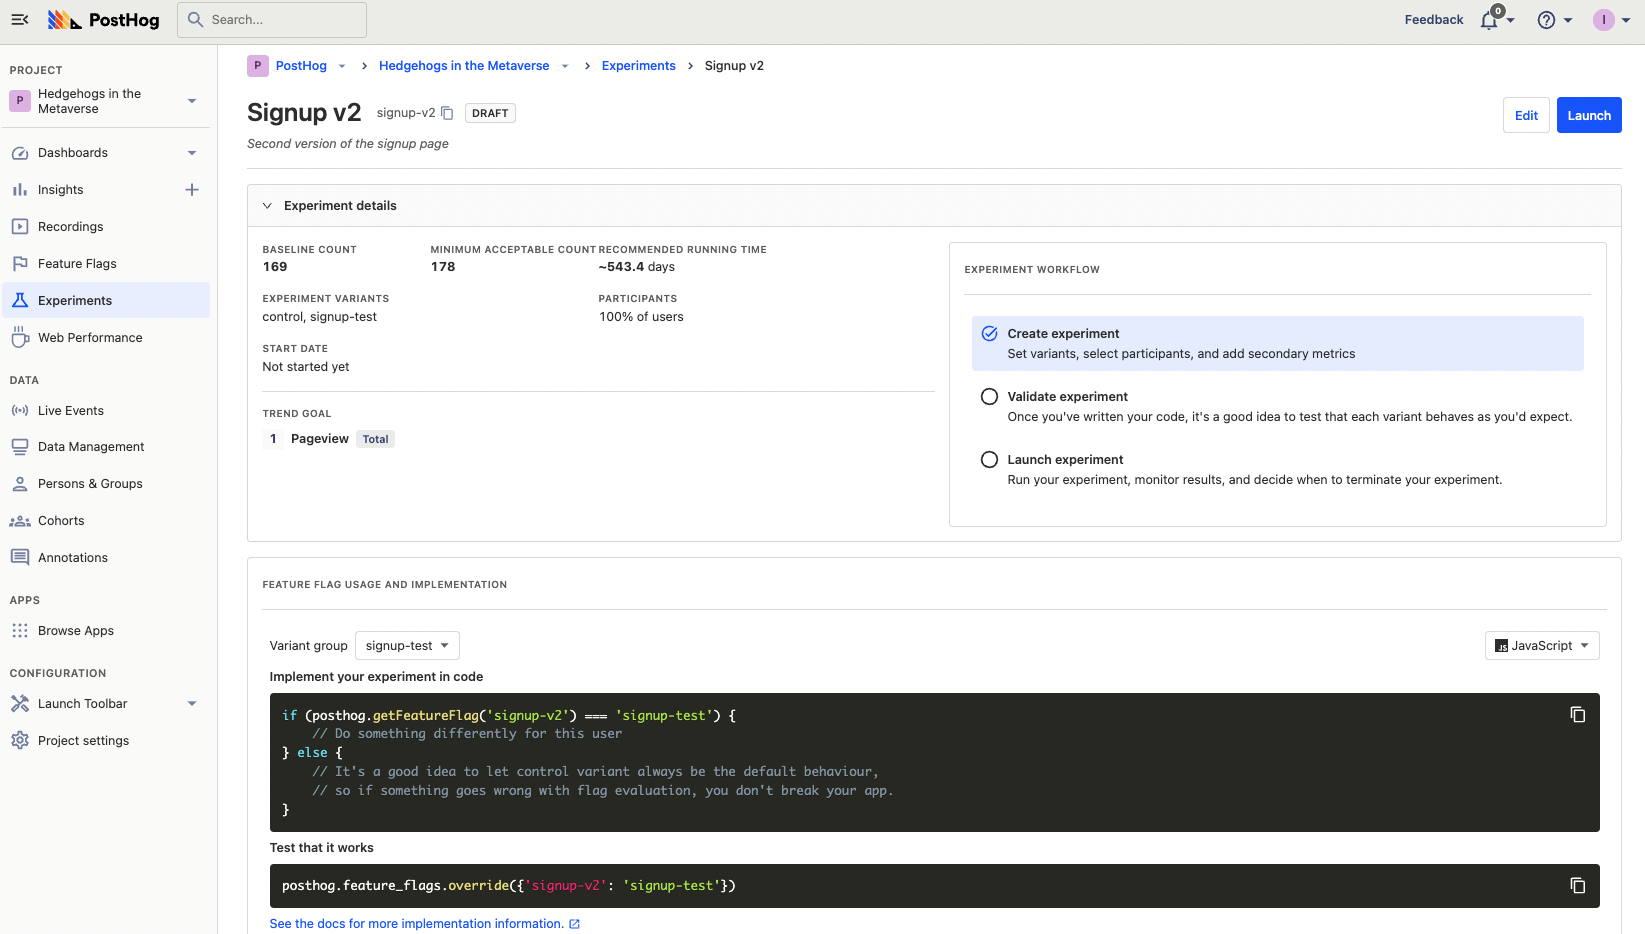
Once created, PostHog creates feature flags for each variant (or you can run experiments without them). Once implemented and launched, PostHog will continuously analyze related event data to tell you if the changes are making a difference. At the end of the test, PostHog helps you decide if the experiment was successful and you can use feature flags to it roll out.

Read more about setting up and using experiments in our product manual.

Further reading

  • Capture more events by deploying a reverse proxy to PostHog Cloud
  • Complete guide to event tracking
  • Calculating average session duration, time on site, and other session-based metrics

Questions?

Was this page useful?

Contributor

  • Ian Vanagas
    Ian Vanagas

Share

Filed under...

  • configuration
  • events
  • dashboards
  • team collaboration
  • notifications and alerts
  • experimentation

Jump to:

  • 1. Configure event capture
  • 2. Build a dashboard
  • 3. Invite your team
  • 4. Create subscriptions to important events, actions, and dashboards
  • 5. Experiment to improve your product
  • Further reading
  • Product

  • Overview
  • Pricing
  • Product analytics
  • Session recording
  • A/B testing
  • Feature flags
  • Apps
  • Customer stories
  • PostHog vs...
  • Docs

  • Quickstart guide
  • Self-hosting
  • Installing PostHog
  • Building an app
  • API
  • Webhooks
  • How PostHog works
  • Data privacy
  • Using PostHog

  • Product manual
  • Apps manuals
  • Tutorials
  • Community

  • Questions?
  • Product roadmap
  • Contributors
  • Partners
  • Newsletter
  • Merch
  • PostHog FM
  • PostHog on GitHub
  • Handbook

  • Getting started
  • Company
  • Strategy
  • How we work
  • Small teams
  • People & Ops
  • Engineering
  • Product
  • Design
  • Marketing
  • Customer success
  • Company

  • About
  • Team
  • Investors
  • Press
  • Blog
  • FAQ
  • Support
  • Careers
© 2023 PostHog, Inc.
  • Code of conduct
  • Privacy policy
  • Terms